Windows,Android apps for Engineers/ Students / Educational / Sports / Health personnel etc.
DRAWING GRAPHS HELP
Data can be presented in many different graphical ways. Basically data can be entered in the data grid, pasted from the windows clipboard or drag & dropped directly onto the graph area or data grid from another program and then displayed in the graph area. Various 2D and 3D graphs may be drawn. Data may be saved, copied to an image file, graphs may be printed. Some 15 and more graph styles can be used to represent data. Data is entered interms of rows and columns.then displayed in the graph area.
To plot graphs. Goto the Graph Data/Settings dialog via the Graph Data/Settings menu option and then click on the Plot Graph menu option as shown below.

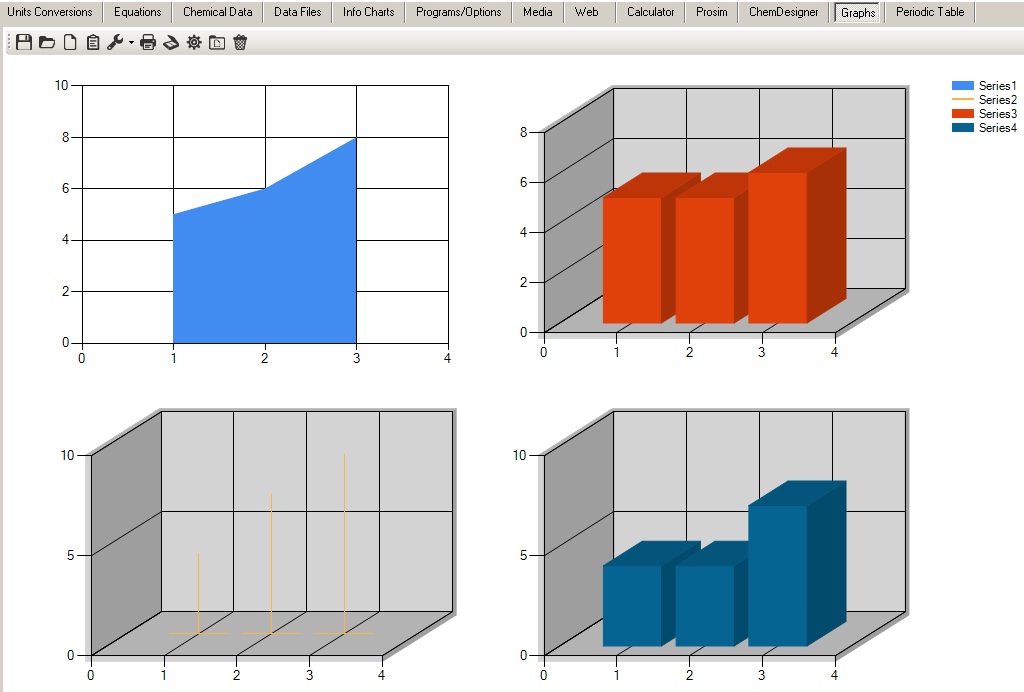
Graphs are represented by Series based on a Area, by plotting each series in different Areas effects like below can be displayed.
Graphs Tool/Menu Bar :-

Following the options Left to Right :-
Save file : saves the current process design to file.
Open file : Allows for a previously saved file to be opened.
Save the file as a Image file. (i.e. gif, jpg etc)
Paste Data from Clipboard : Paste the data into the graph. Allows the pasting of data from the Windows clipboard onto the graph. If current data exists on the graph an option will be displayed to either clear the existing data or add the new paste data to the existing graph.
Tools : provides graph options.
Data Option :-
Selecting the data option displays the Graphs Data and Settings dialog. Data can be enter directly or drop/drag directly onto the data grid or click the paste button to paste directly from the Windows clipboard.
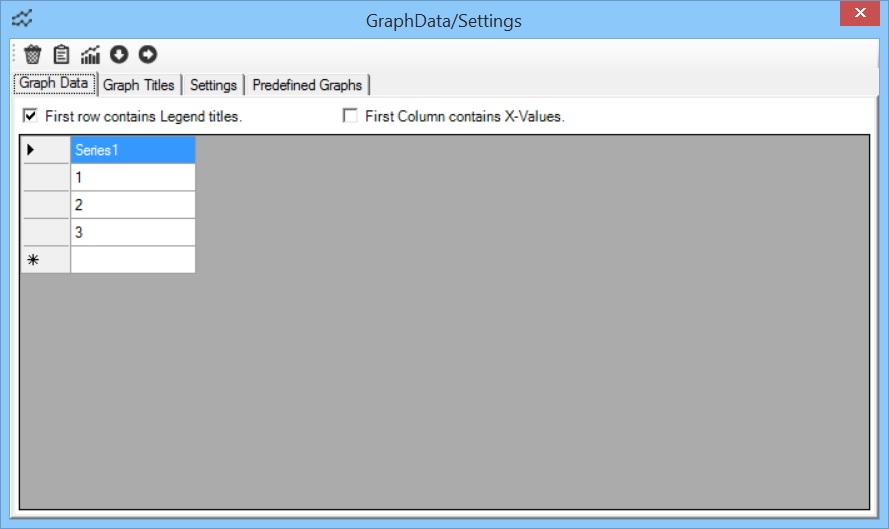
Data values are displayed entered in series. Each Column of data represents a series.
From the screen image below :-
The first row contains legend titles means the values in the first row will appear as legend titles for each series on the displayed graph.
The first column contains X-values, means the values in the first column are x-values for each other series.
Data Tool/Menu bar :-

Clear Graph : Clears the data and displayed graph.
Paste Clipboard Data : Paste the data into the graph. Allows the pasting of data from the Windows clipboard onto the graph. If current data exists on the graph an option will be displayed to either clear the
existing data or add the new paste data to the existing graph.
Plot Data to Graph : Plots the data to display a graph.
Add a new grid/data row : Adds a new row to the data grid.
Add a new grid/data Column : Adds a new column (Series data) to the data grid.
Graph Titles Tab :-
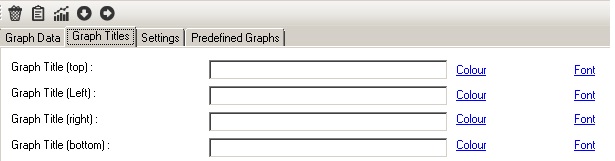
Add titles to the graph and change each titles colour and font by clicking on the colour and font links.
Settings Tab :-
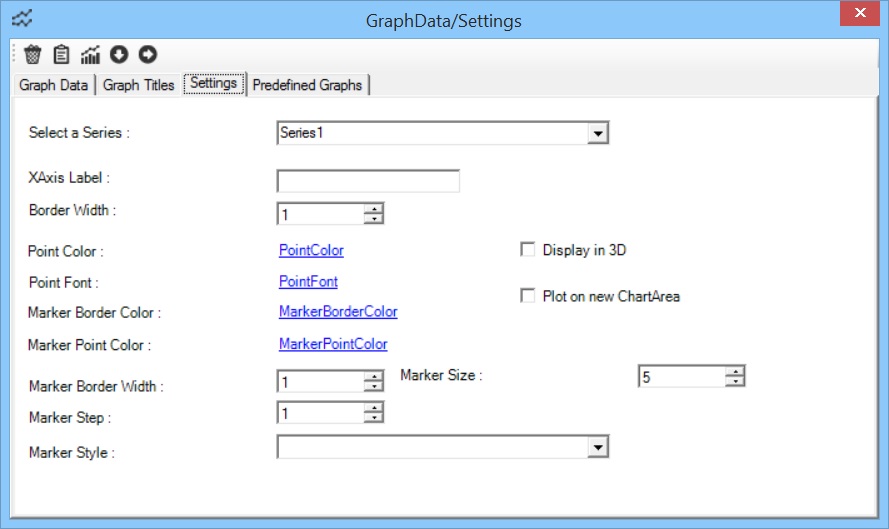
Select a Series : Select the series that the changes are required.
XAxis Label : Enter a value for the X labels.
Point Colour : Allows for different colour options for graph points to be set. Click the PointColor link to display the colour options dialog.
Point Font : Allows for different Font options for graph points to be set. Click the PointFont link to display the font options dialog.
Marker Border Color : Allows for different colour options for graph border points to be set. Click the MarkerBorderColor link to display the colour options dialog.
Marker Point Color : Allows for different colour options for graph marker points to be set. Click the MarkerPointColor link to display the colour options dialog.
Marker Border Width : Option allows for different marker border width for the series to be set.
Marker Step : Option allows for different X axis spacings for the series to be set.
Marker Style : Option allows for different marker styles for the series to be set.
Marker Size : Option allows for different marker size for the series to be set.
Display in 3D : Allows the series to be plotted in 3D style. Note : certain types of graphs can only be plotted in 3D on a separate Area from other types of series.
Plot on NewChartArea : Allows the series to be plotted alone in it's own separate graph. (otherwise plotted on default Area.) Note : certain types of graphs i.e. 3D can only be plotted on a separate Area.
Predefined graphs Tab :
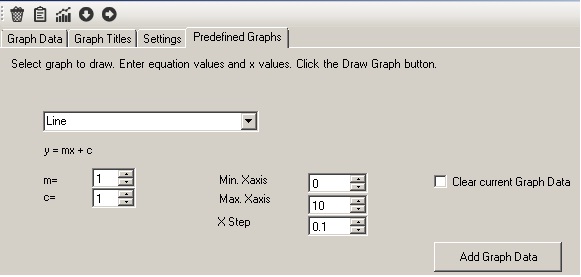
Graphs ListBox : Select a predefined graph from the dropdown list box. Enter values for the graphs variables. i.e. Line graph enter values fro the gradient, m, and y-intercept,y. Specifiy the X Axis range via the X-min and X-max settings. Always specify the X-step for x values to be caculated and displayed. Click the "Clear current Graph Data" checkbox to clear the existing graph data. Click the "Add Graph Data" to calculate the graph points and populate the "Graph Data" grid. Click the "Plot Graph" toolbar menu option to display the graph. Note that the range of points are deteremined by the first series of data.
Data Series menu option :
Mouse Hover over the data series menu option for a few seconds and wait for all the existing graph series to be displayed as further menu options, as shown below :
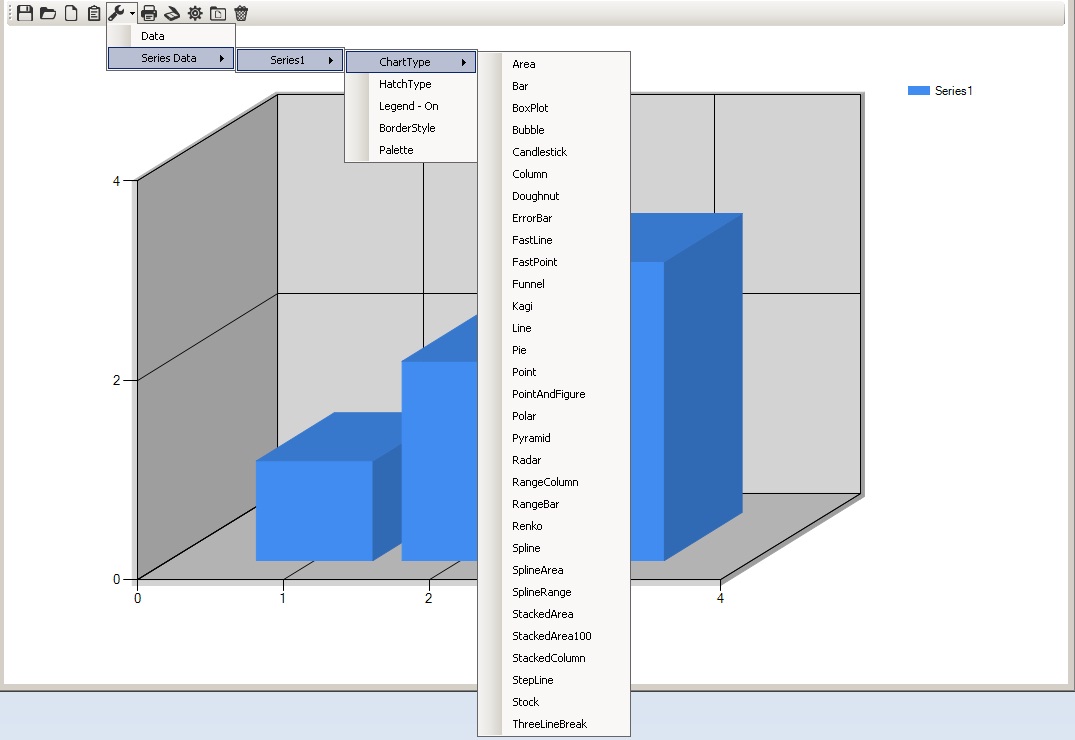
ChartType : Mouse Hover over the ChartType for a list of possible graphs the series can be displayed in. Mouse click on the desired graph. (Note : not every graph type can be displayed in conjuction with every different series with different graph type i.e. 3D graphs. They may need to be displayed in separate ChartAreas. This can be selected in the Settings Series Options. (Data/Graph Options).)
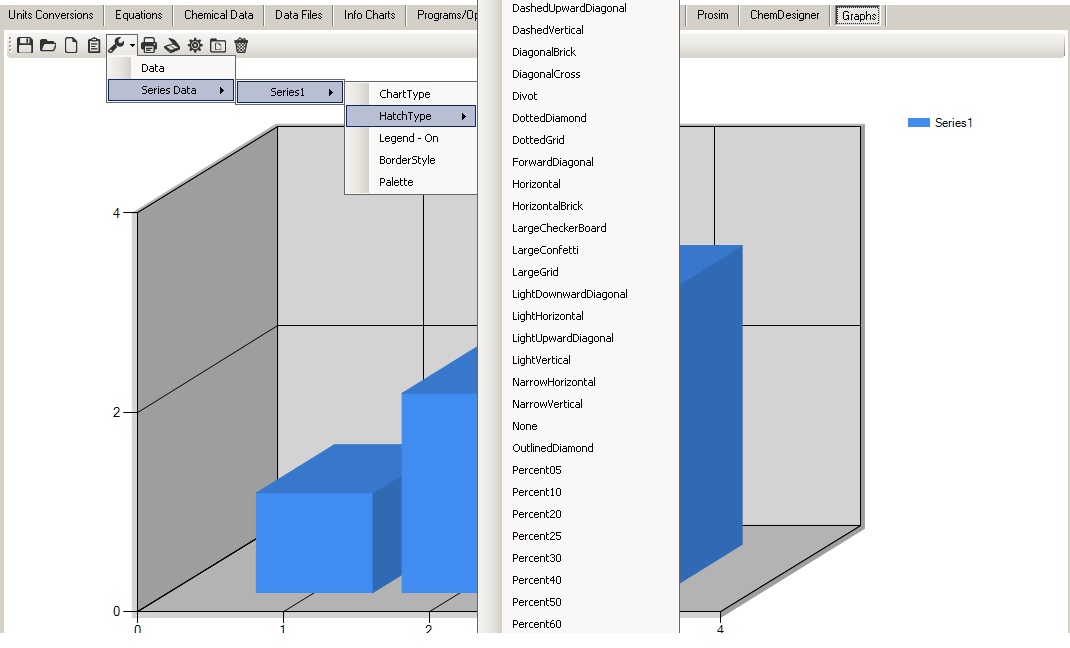
HatchType : Mouse Hover over the HatchType for a list of possible Hatch Styles the series can be displayed in. Mouse click on the desired Hatch Style.
Legend - On : Mouse Click on this option to either display the Series in the Graph legend or not. The default is On.
Border Style : Mouse Hover over the BorderStyle for a list of possible Border Styles the series can be displayed in. Mouse click on the desired Border Style.
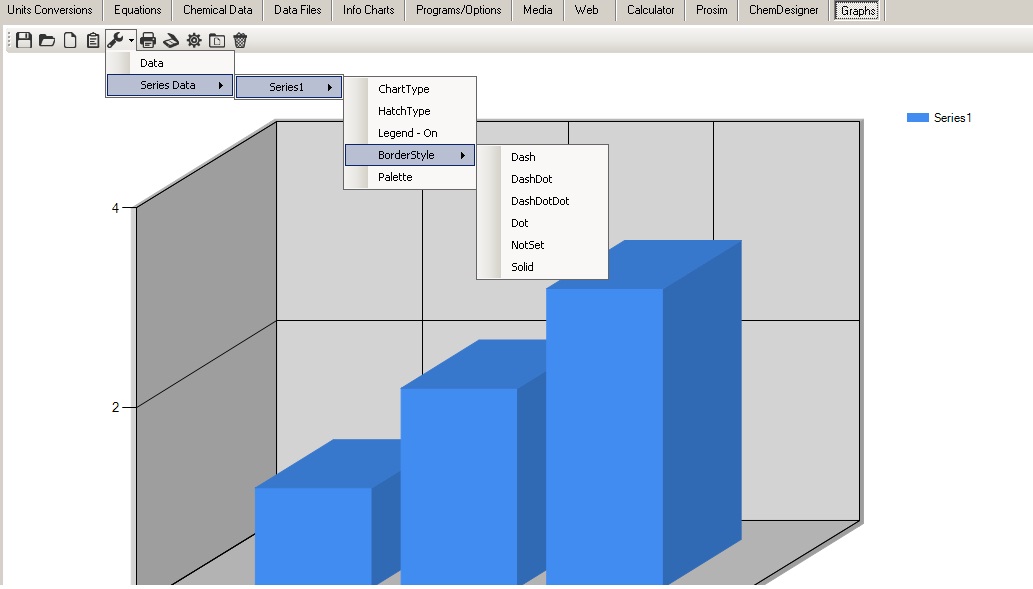
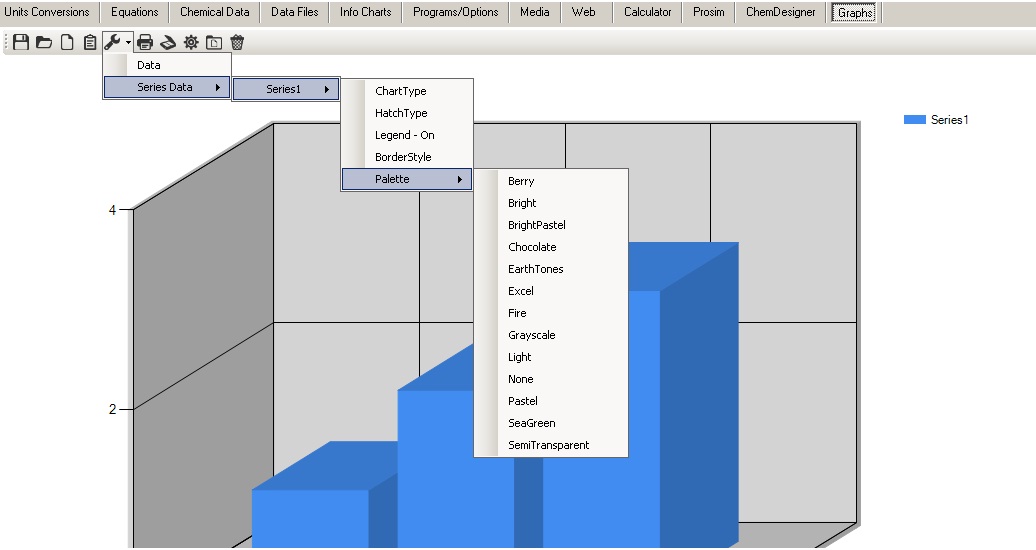
Palette : Mouse Hover over the Palette for a list of possible Palette Styles the series can be displayed in. Mouse click on the desired Palette Style.
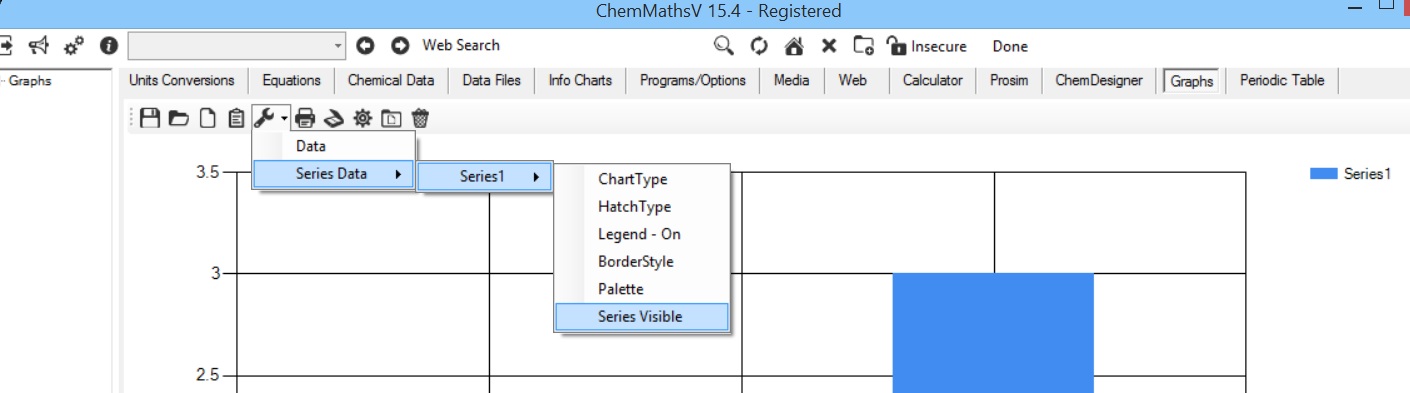
Series Visible : Mouse Click on this option to hide or display the series in the display graph.
Print : Print the graph to the printer.
Print Preview : Preview the displayed graph before printing.
Displays Graph Data/Settings : Displays the Graph DAta/Settings dialog. Enables graph data to be directly entered in the data grid and Graphs settings to be accessed etc ....
Setup Print Page : Allows adjustments for the printer page.
Clear Graph : Clears the displayed graph and data.
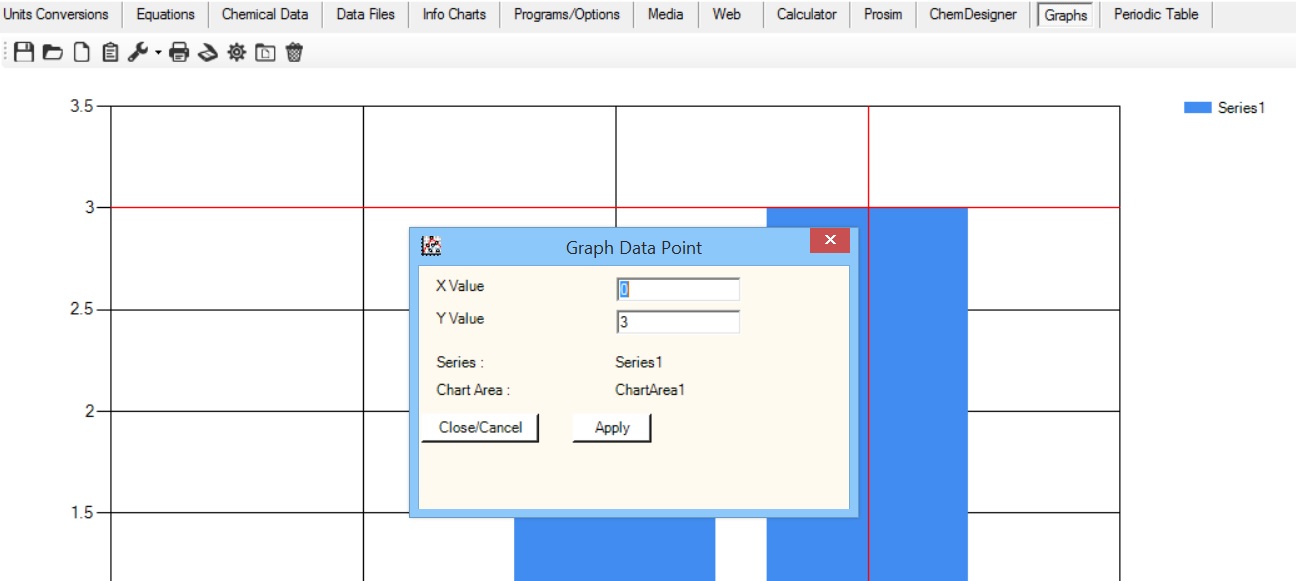
Extras :-
By double mouse clicking directly on a point in the displayed graph, allows for view and alteraction of the data point.
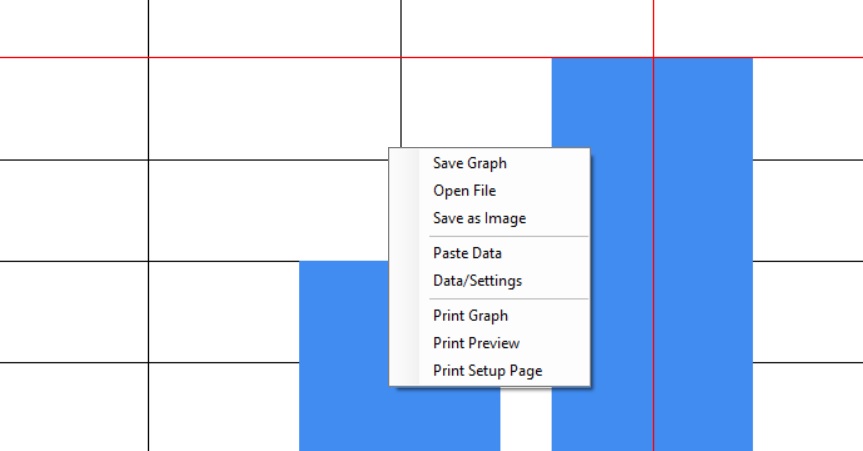
Right Mouse Click menu :-
Offers menu shortcuts to the main menu options.